If you click on an individual query, a pop-up window will provide
more detailed information about the individual query. You can see
an example of this in the figure below. The available tabs within
this window will depend on whether you have configured the more
detailed query information. By default, you will always be
provided the Summary Details page. If enabled, you may also view
Example Details, which provide more detailed data about a specific
query, including the data and parameters submitted. In addition,
you may also enable Example Explain, which provides you with the
ability to remotely execute an EXPLAIN
statement with the specified query and view the resulting
information.
-
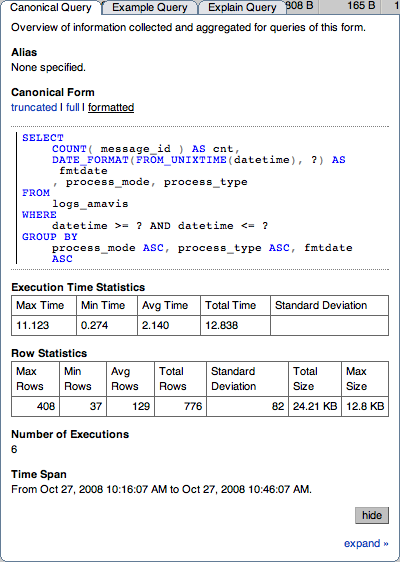
The Canonical Query tab:
In addition to the summary information given in the table, you will get detailed execution statistics, including the minimum time, maximum time, average time, total time and the standard deviation. The standard deviation will enable you to determine whether a particular invocation of a query is outside the normal distribution of times for the given query.
Row statistics provide more detailed contents on the maximum, minimum, average, total, and standard deviation for the number of rows returned by the query, and the total size and maximum size of the data returned. The time period for the total and average figures is shown under the Summary Time Span.
The detailed view for a query also provides three different views of the query. The
truncatedversion is a shortened version of the query. Thefullversion of the query is the entire query statement. Normalization removes the constants from the individual queries so that queries following the same logical structure are identified as the same basic query.To close the query detail window, click the button.
To simplify the identification of a given query, you can create a query alias. The alias will be used in place of the normalized query text within the Query Analyzer table. To create an alias for a query, click the link against the query. The maximum length for a query alias is 255 characters.
-
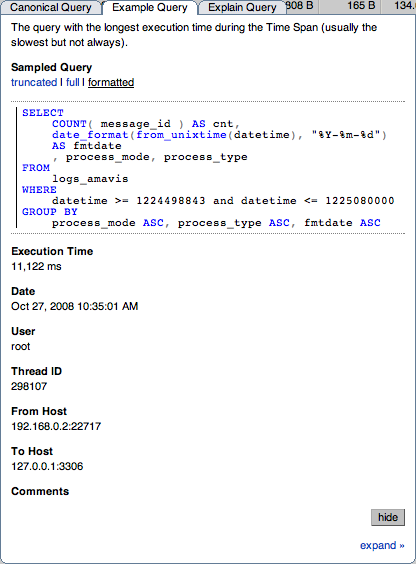
The Example Query tab:
The Example Details tab provides detailed information about the most expensive query executed, as determined by the execution time.
In addition to the full query, with data, that was executed, the tab shows the execution time, data, user, thread ID, client host and execution host for the given query.
-
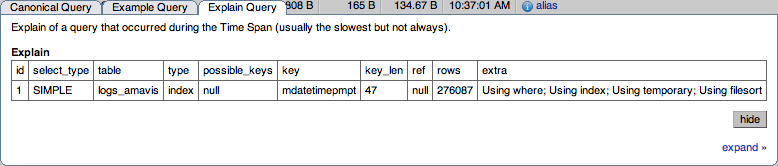
The Explain Query tab:
The Example Explain tab enables you to view the output from running the query with the
EXPLAINprefix. For more information, see Section 12.3.2, “EXPLAINSyntax”.
User Comments
Add your own comment.